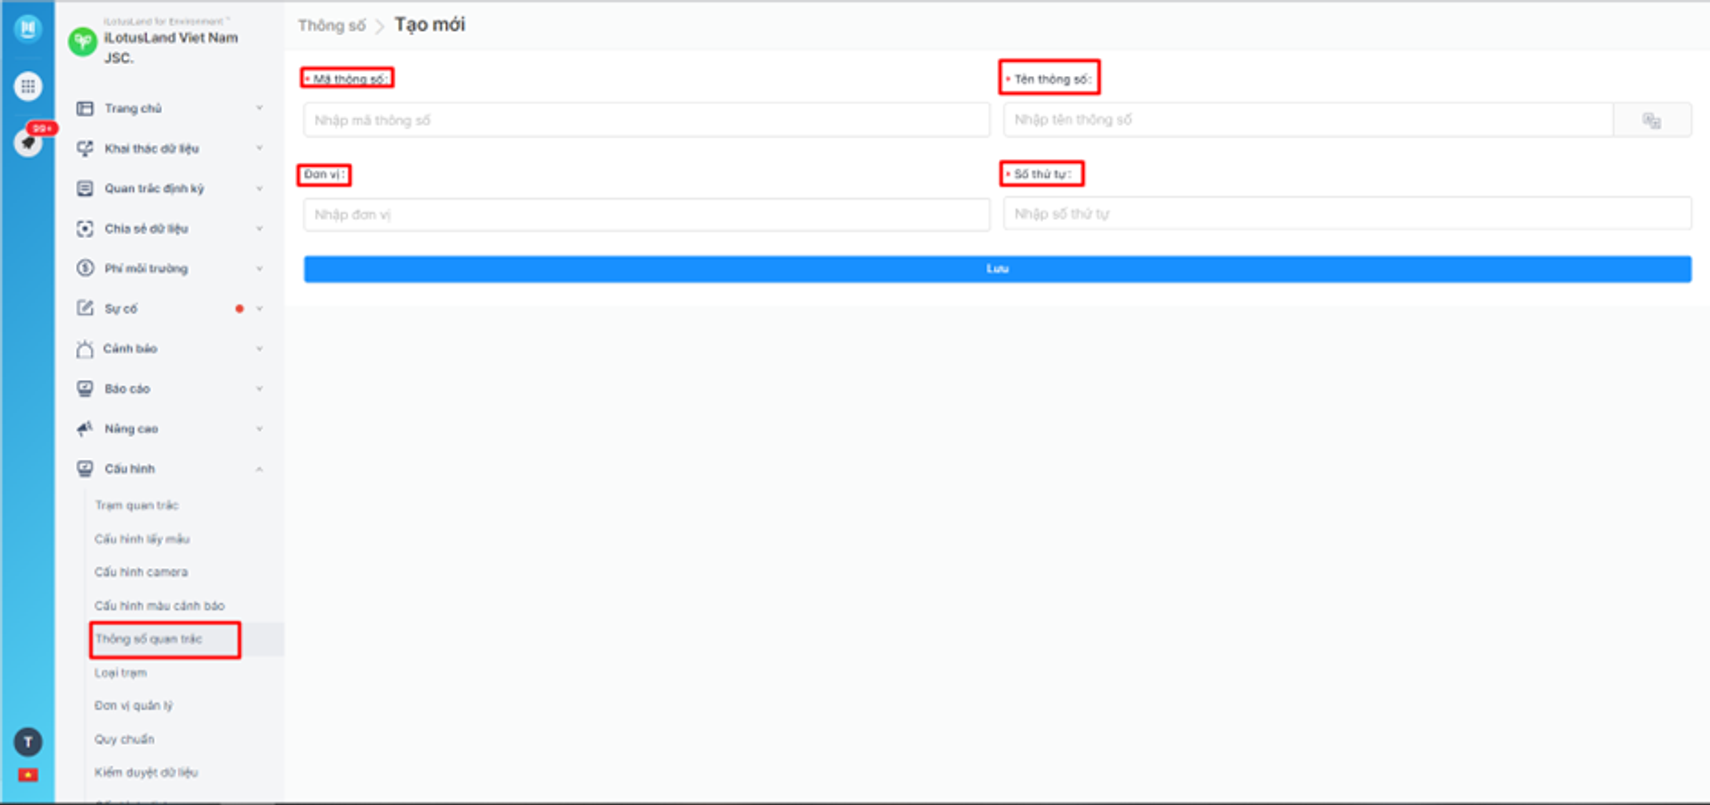
💡 After logging in, user goes to the menu Configuration → choose The monitoring parameters → choose Create new.
Steps to create new monitoring indicators:
Step 1: Enter the parameter code.
Step 2: Enter the parameter name.
Step 3: Enter units (optional).
Step 4: Enter the parameter number in the list of all parameters.
Step 5: Press Save to finish the new creation operation.
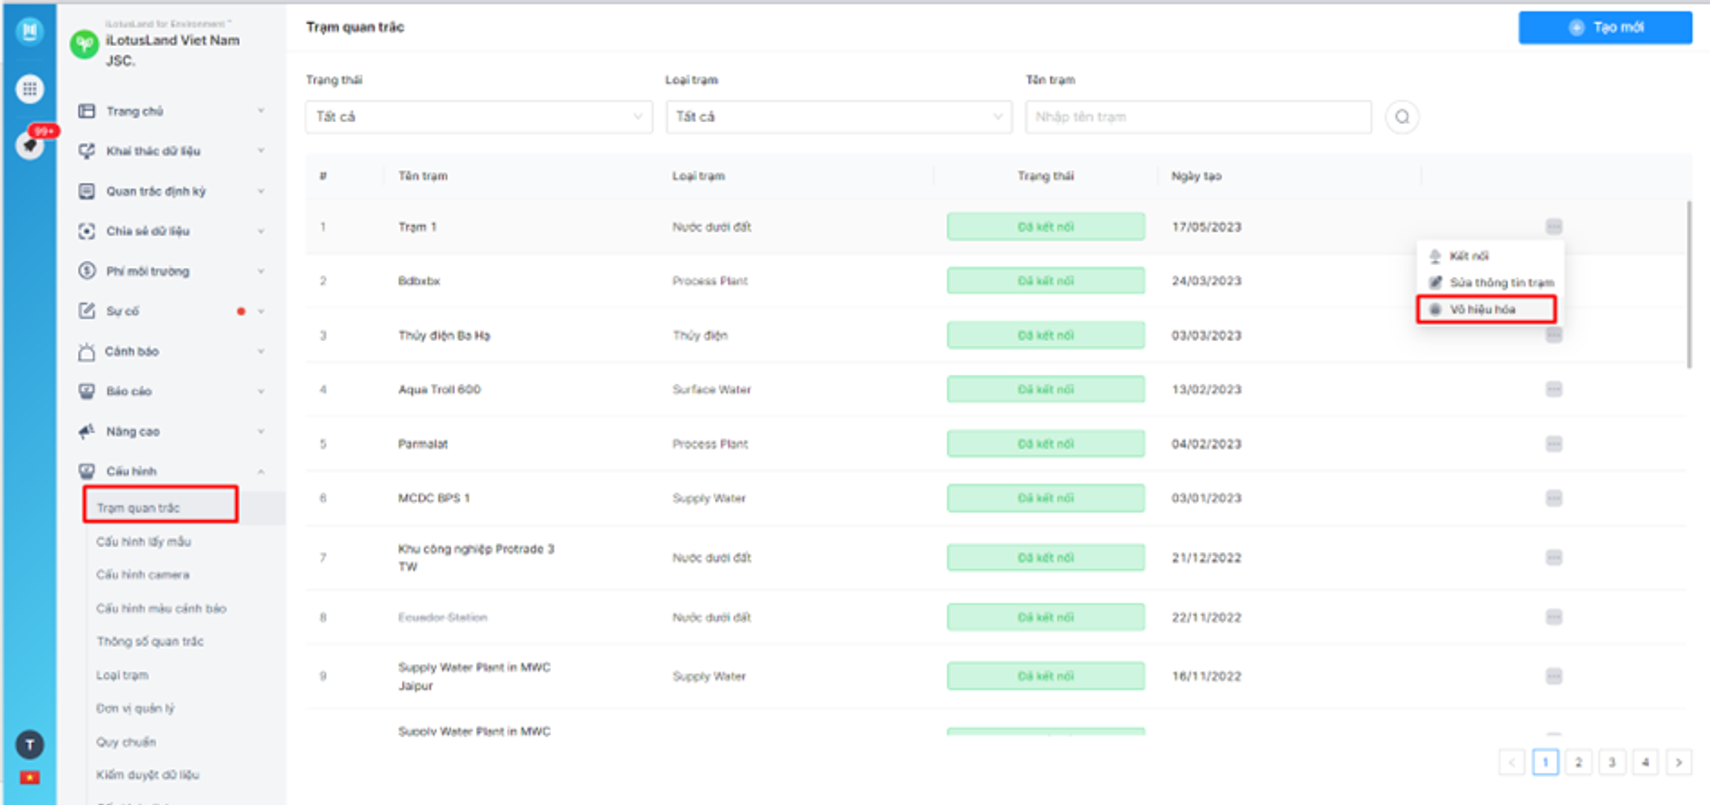
💡 After disabling any monitoring station, users can Restore or Remove.
Steps to disable and restore the monitoring station:
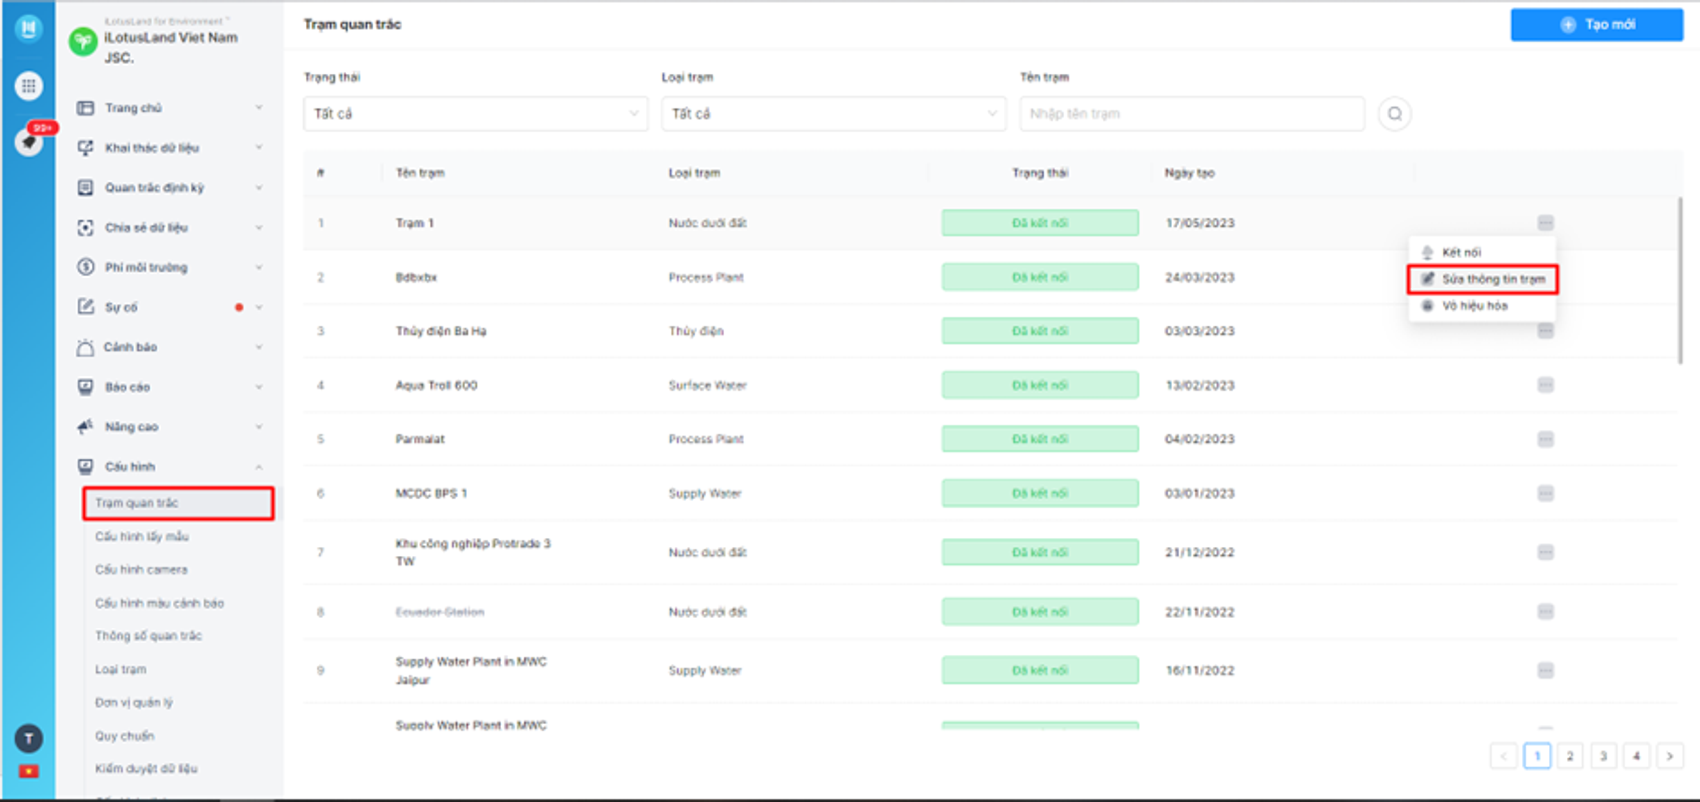
Step 1: User goes to menu Configuration → choose Monitoring station → search and select the station to be disabled.
Step 2: Choose Disable.
Step 3: Press the icon and select Restore
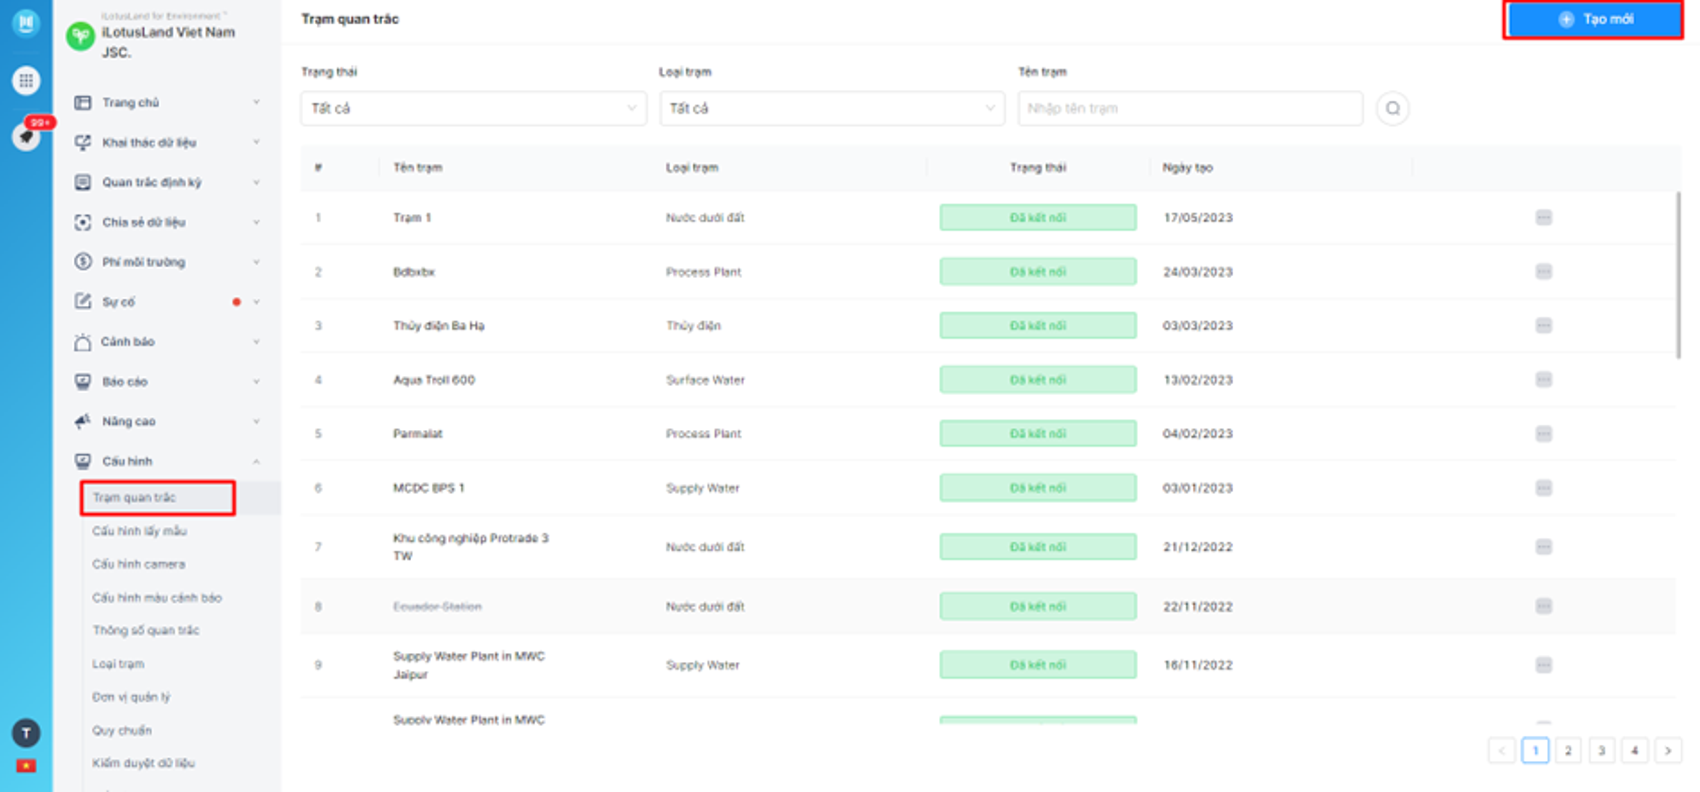
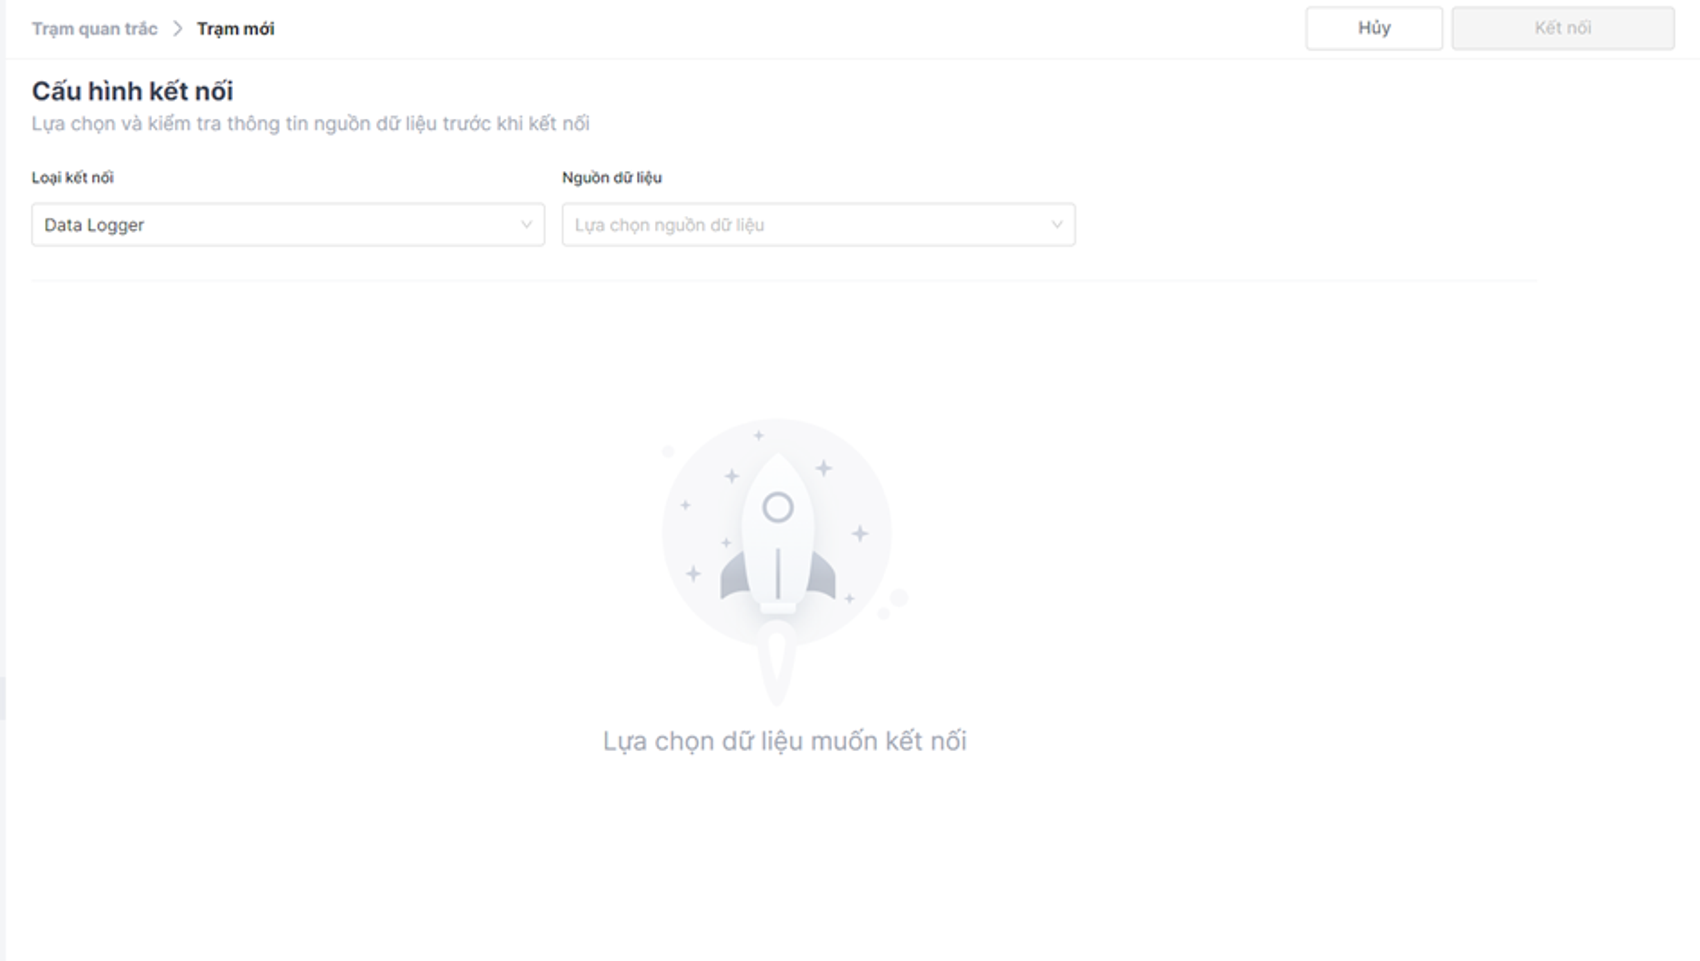
💡 Go to menu Configuration → choose Monitoring station → choose Create new.
Steps to create a new monitoring station:
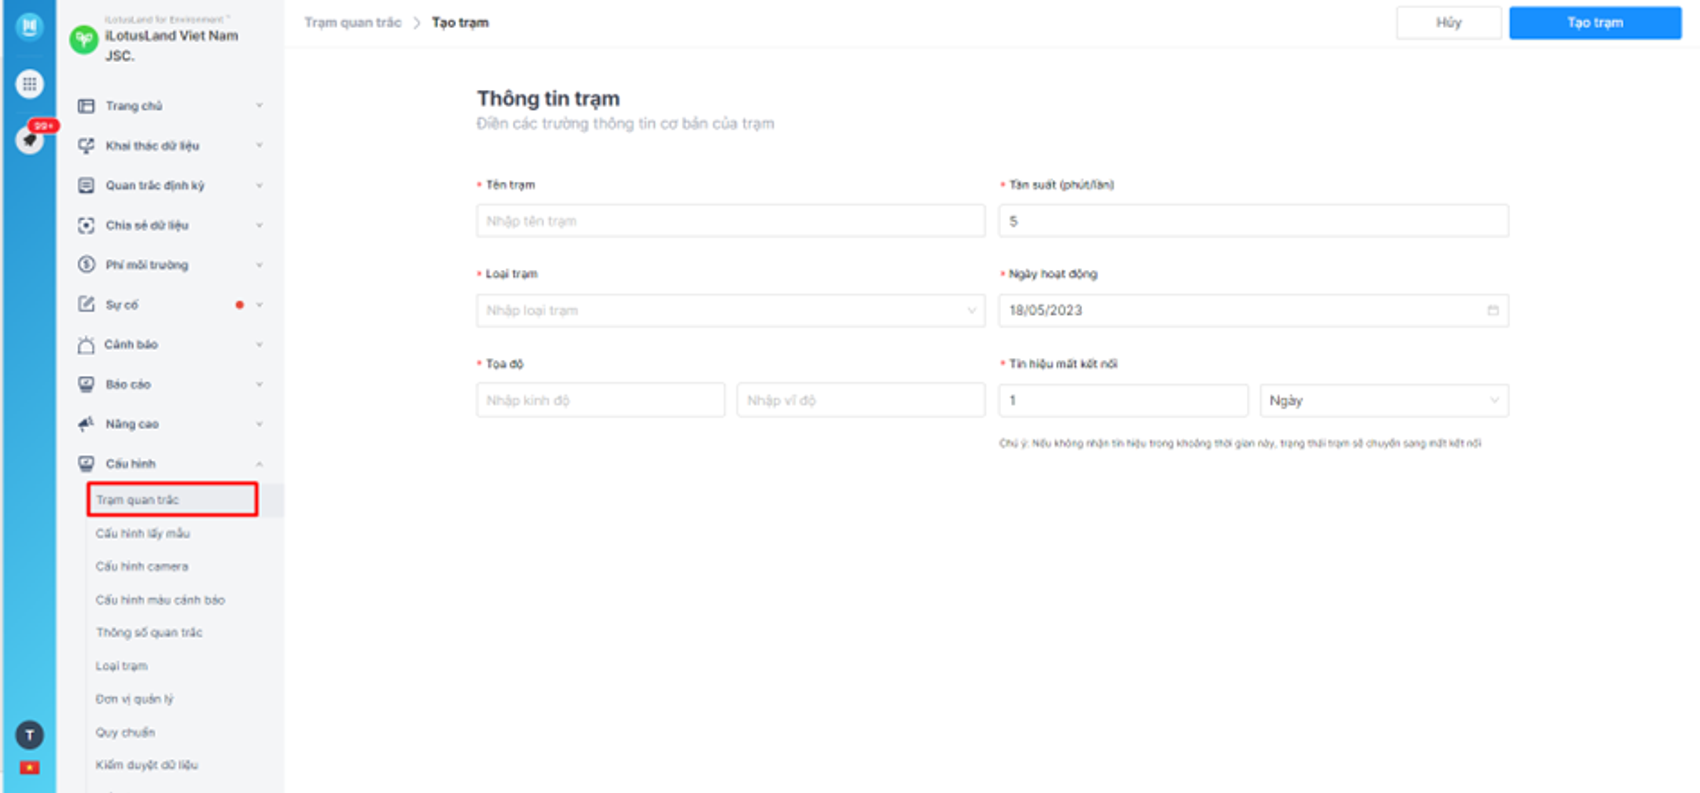
Step 1: Enter basic station information for the station;
Note:
1. Station name (required information).
2. Frequency (minutes/time) (information not required).
3. Select the station type.
4. Station operating date (optional information).
5. Station coordinates;
Longitude WGS84 (required information).
WGS84 latitude (required information).
6. Lost connection signal allows users to set signal update time.
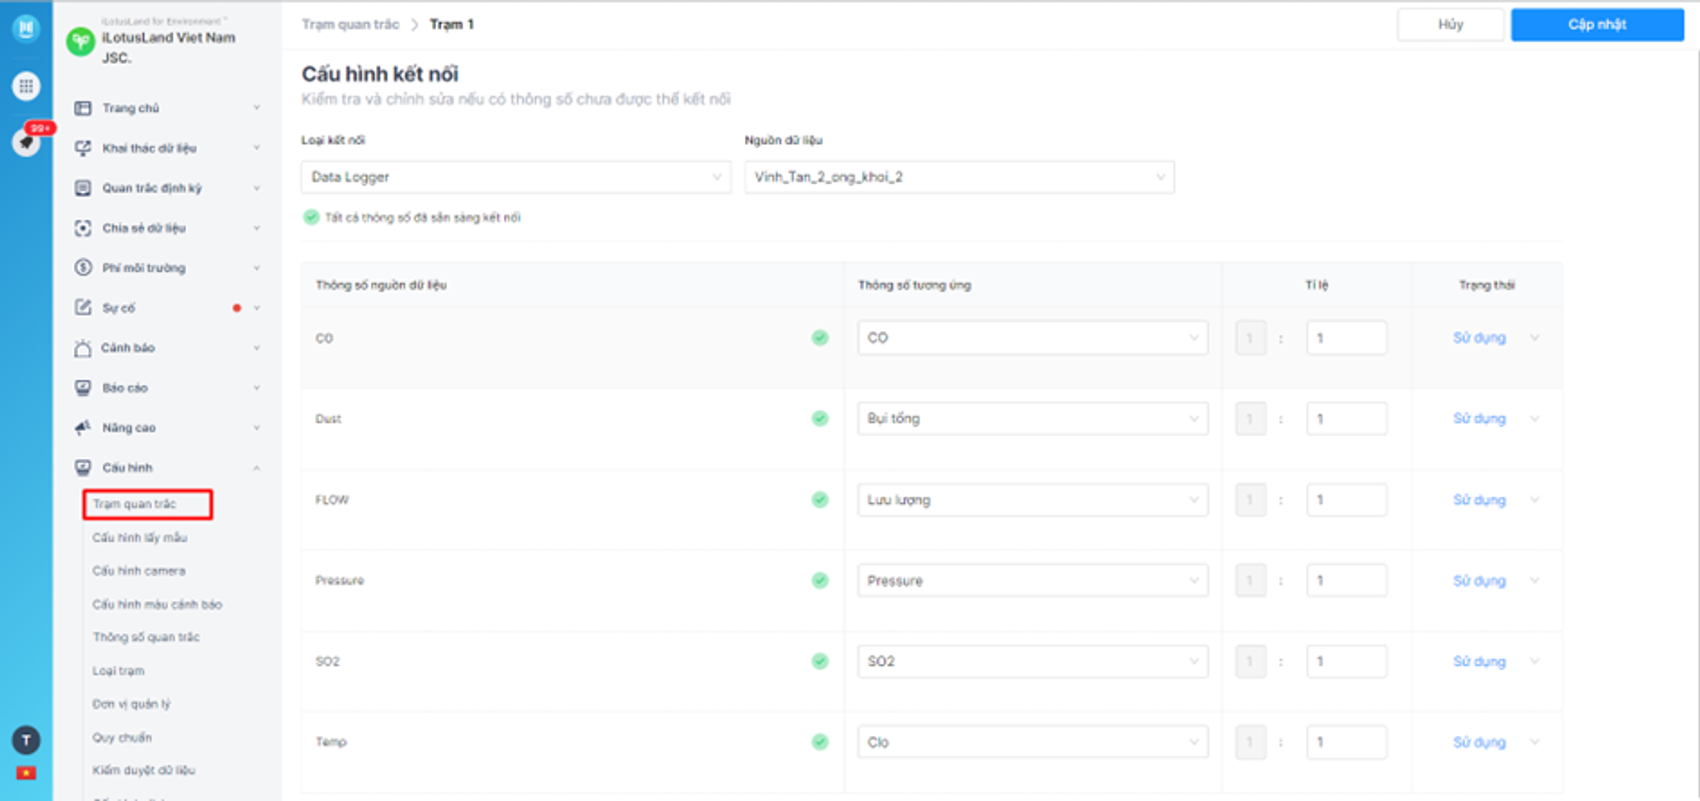
Step 2: Connection for station;
Proceed to select the data type → data source in turn: select the data source of the monitoring station just created (the data source name is taken from the name of the txt file containing the data of the monitoring station transmitted by FTP protocol);
Corresponding parameters: allows selecting the corresponding parameters the user wishes to "mapping" with the parameters of the source connection.
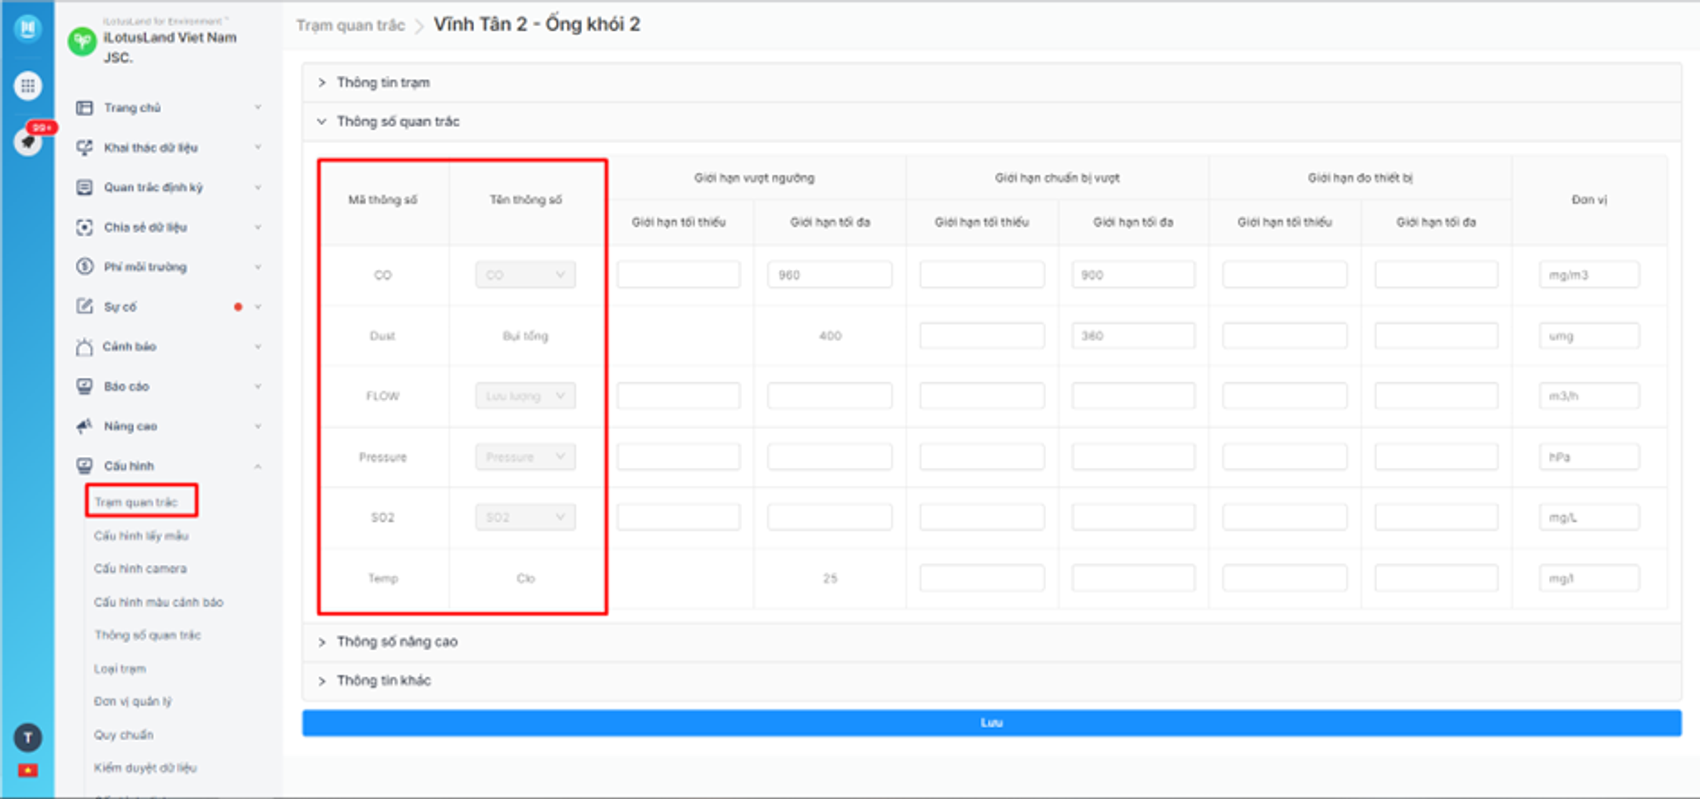
Step 3: Configure thresholds for parameters.
At page Monitoring station configuration → Choose Edit station information;
Especially when selecting a set of standards for a station, the system will automatically assign the maximum and minimum threshold values to that parameter position configured in the set of standards.
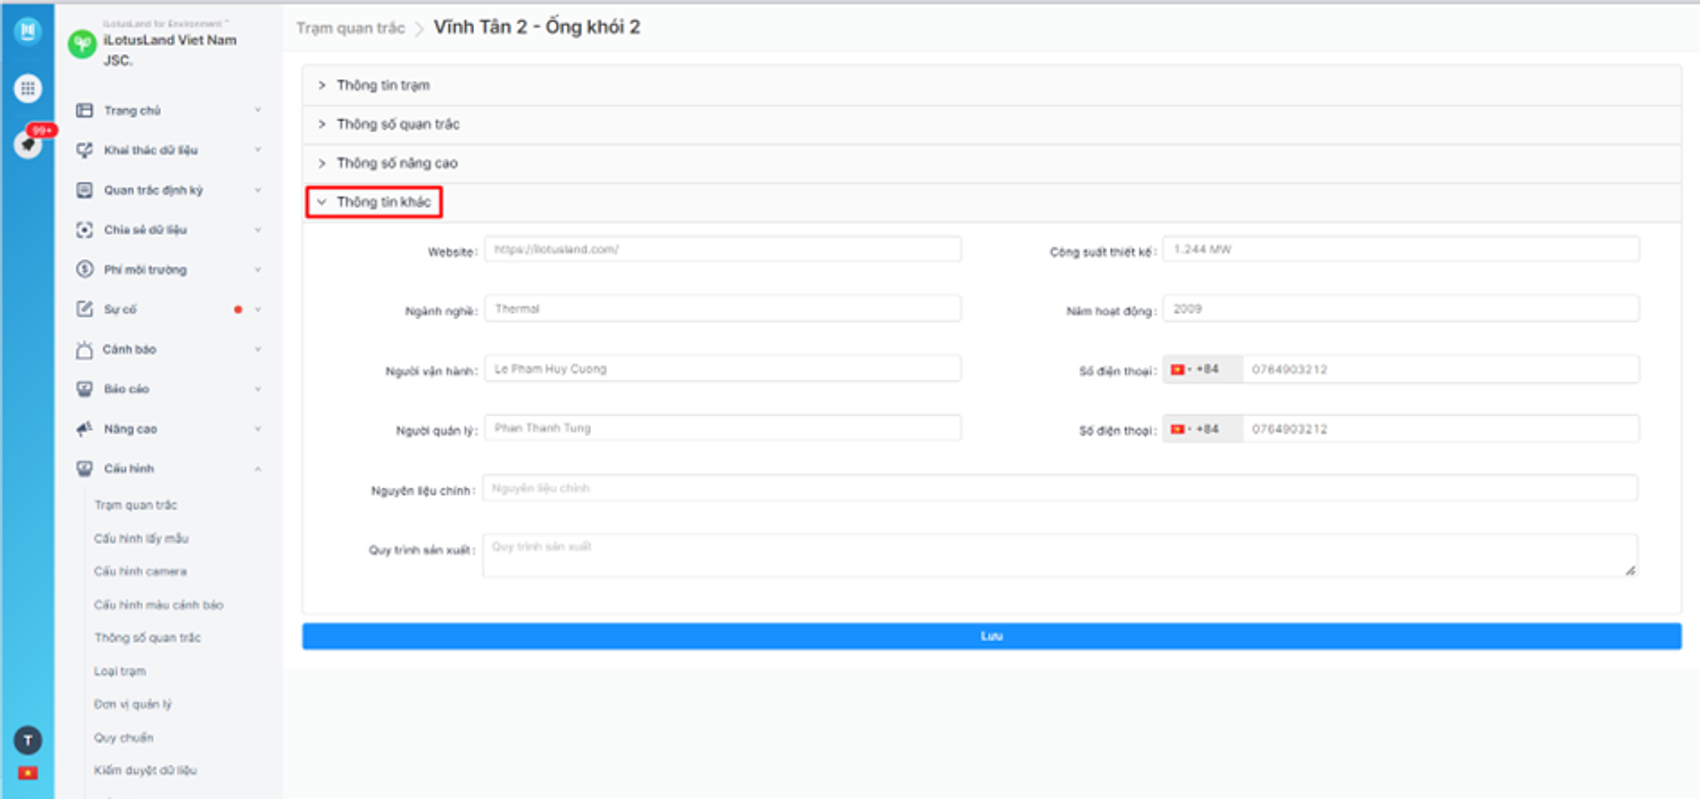
Step 4: Enter Other information (optional);
💡 The steps are as follows:
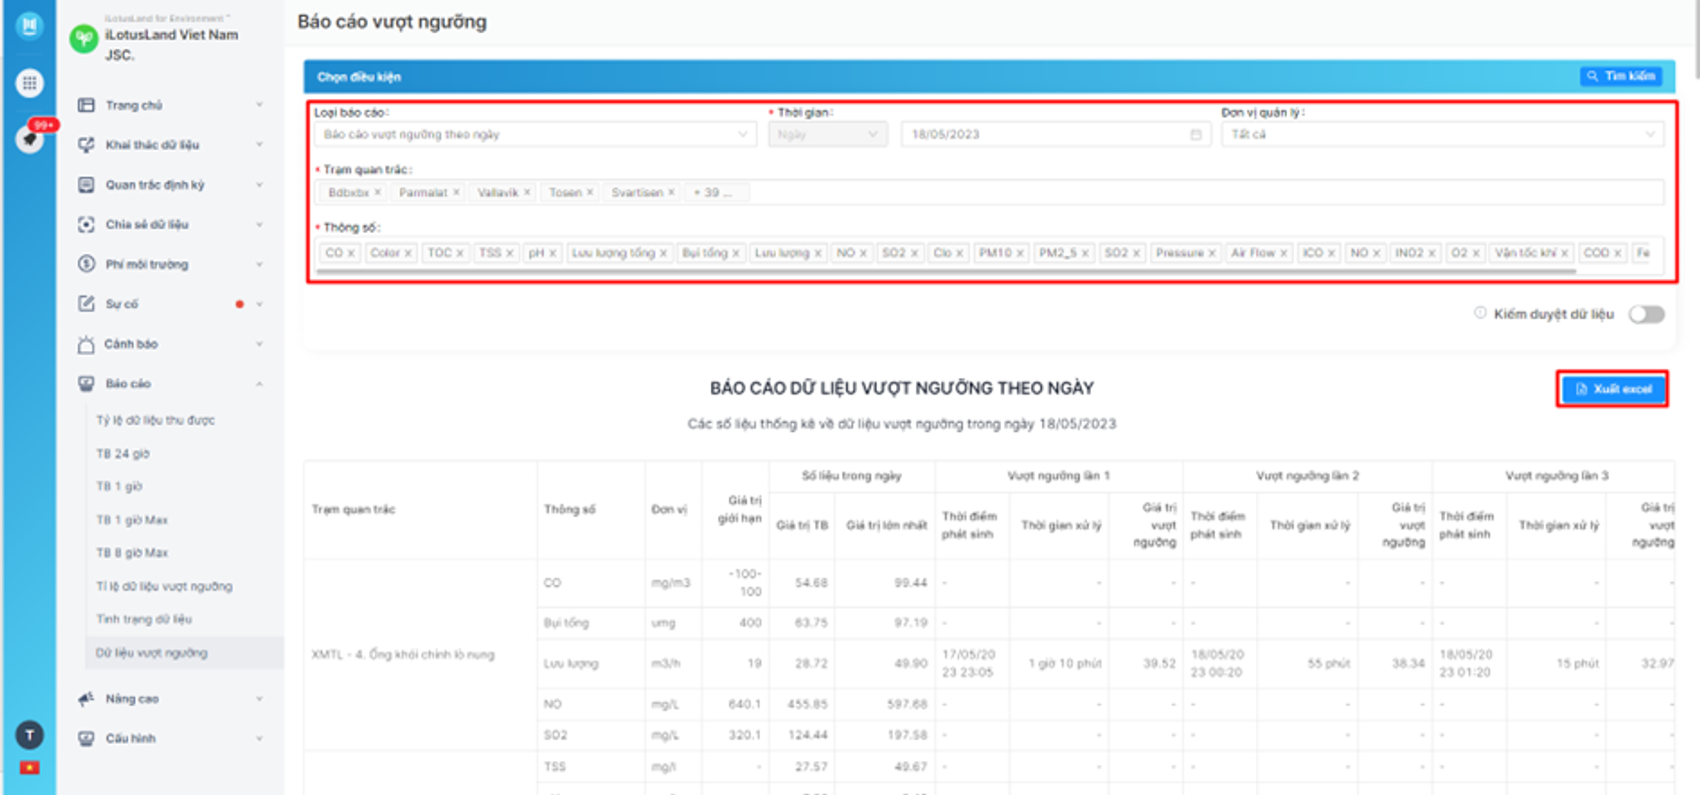
Step 1: Select filter conditions;
Step 2: Press Search;
Step 3: Press Export Excel data
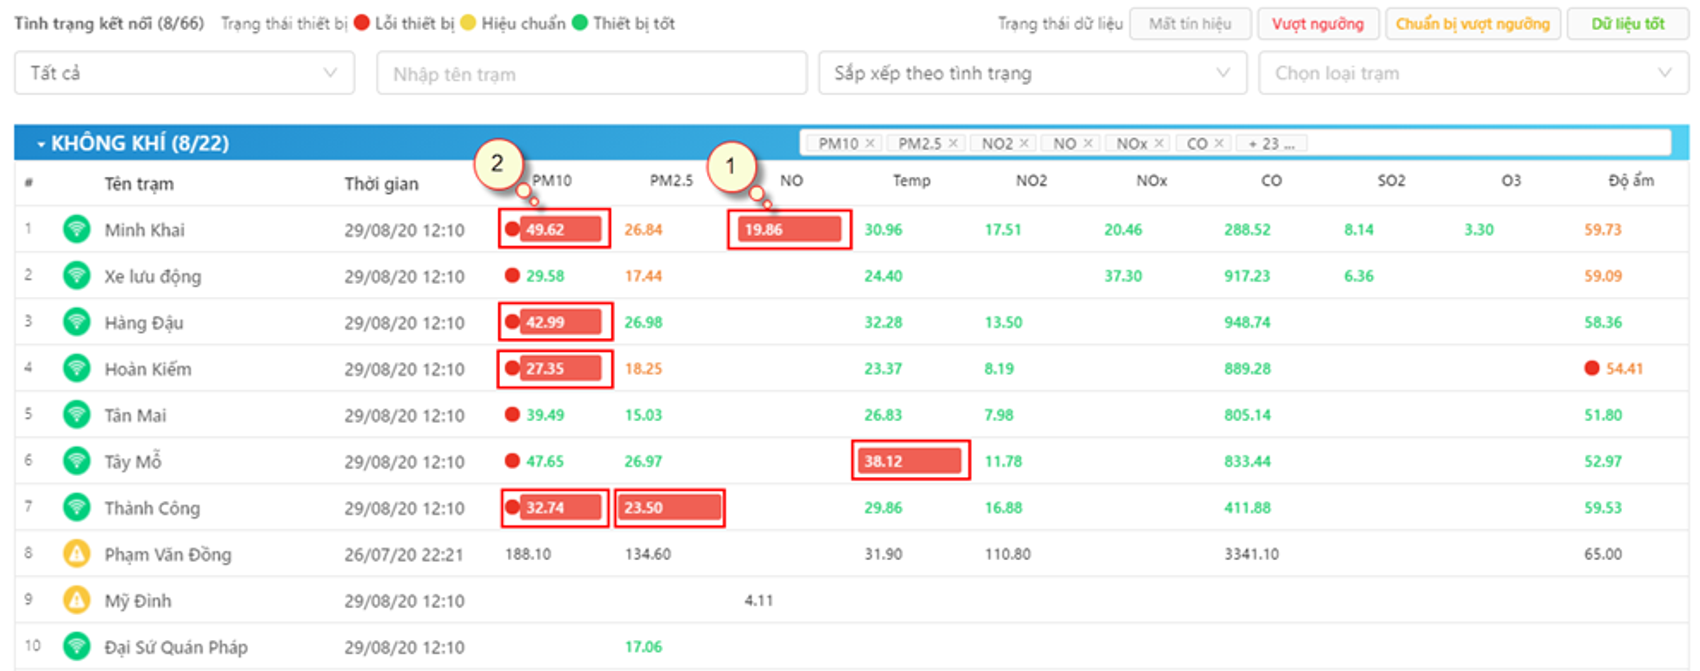
Data that exceeds the threshold are data that flashes red. When there is data that exceeds the threshold, the system warns with an immediate sound at the time the data is updated.
Flashing red figures accompanied by a red dot symbol indicate an error device status.
Lost signal
1. Indicators show no data
2. The dot shows the device's signal loss.
3. The cell border shows the data status: good.
4. Limits of targets.
Exceeded threshold
1. Dots represent: device error.
2. Data color + cell border shows data status: good.
3. There are no limits.
Conditions: You must be a system administrator and have access to the data-receiving server.
Step 1: Access the data-receiving server.
Step 2: Open CMD with Administrator rights on the data receiving server
Step 3: Run pm2 commands to test the file processing service.
pm2 ls command: command to check whether the file processing service is still available or not.
pm2 log (id) command: checks the log to ensure the file processing service is still operating normally and identifies errors, if any. Note: id is just the identifier of the file processing process number, here I am 1 and because the system has only 1 file reading service, we only care about the name of the file reading service and then look up the corresponding ID number by command pm2 ls. As follows:
Through the logs command, we can see whether the file on the system is processed or not.
You must be a system administrator and have access to the server receiving data.
When the process fails or is lost, it will display as shown below:
We need to perform the following steps:
Step 1: Open CMD and run administrator rights in the collector server.
Step 2: try the pm2 start (id) command: to run the stopped service again. Or the pm2 revive command to restore the service if progress is lost.
Step 3: use pm2 logs command to check that the service is running.
Note: When performing step 3 and the file processing service is still not working, you should use the command pm2 delete (id) to delete the current service. Then access the path containing the Source code with CMD and use the pm2 reload ecosystem.config.js command to initiate the new service. When following the above steps and still not working, you can send an email to the address [email protected] for further support
As shown below:
Enter the password you want to change and click change password when done!
Không tìm thấy bất kỳ câu hỏi nào, xin vui lòng liên hệ với tôi
Contact us